Overview
It needs some tricks and attentions when creating histogram chart with Echarts, considering the fact that there is no inbuilt histogram chart in Echarts and a bar chart component is needed.

It needs some tricks and attentions when creating histogram chart with Echarts, considering the fact that there is no inbuilt histogram chart in Echarts and a bar chart component is needed.

It's not easy to create a proper multiple series boxplot chart with decent tooltips in Echarts, and it will be much more complex when combining boxplot chart with outliers. I'm going to tell you how to make that happen and what's the pros and cons of each approach in this article.

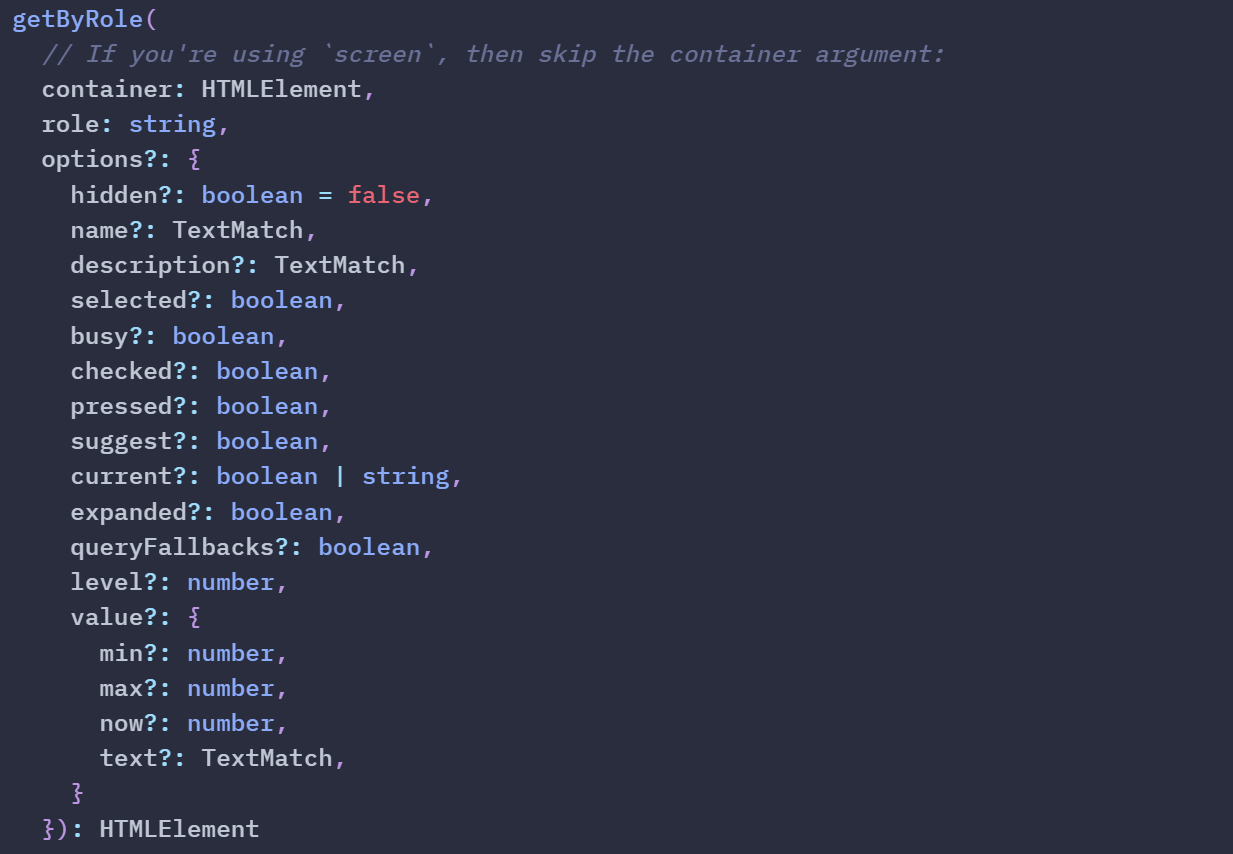
When using getByRole from react-testing-library to retrieve the component/element content, it should be quite straightforward, but when the component/element is wrapped with the Tooltip component from Material UI, something weird happen: getByRole can only get the content of the tooltip rather than the component/element content. This article is going to explain why such issue happen and how to fix it.

Creating a heatmap chart in Echarts typically involves utilizing the series.data property in conjunction with the xAxis.data and yAxis.data properties. However, this method often requires many data manipulation and lacks flexibility. This article sets out to investigate an alternative approach to crafting more adaptable and potent heatmap charts in Echarts with React, a technique not covered in the official documentation.

Passing props to components in React is a commonplace practice, yet it differs when passing props to children component. While one approach involves using the cloneElement and/or Children API to manipulate and transform the JSX received as the children prop, this method presents certain pitfalls, and those two APIs are legacy. This article aims to explore alternative, more effective methods to attain the same outcome.

It's common to have a header and footer in PDF reports, but making them work properly is not as simple as it may seem. This article presents a practical solution for printing PDF reports with header and footer in the frontend.

Generating PDF reports on the frontend, especially when dealing with charts like those from Echarts, can be challenging. Properly handling chart layouts and accommodating various screen sizes adds complexity. This article presents a practical solution for printing PDF reports with Echarts on the frontend.

WebSocket is a new technology coming with HTML5, and the first time I saw it, it confused me with REST API. So in this article, the following questions will be answered.

I have done projects with normal CSS, SASS, and also a project with styled components, but haven't done any project with CSS modules.
As I'm going to do a new project, and considering the issues I met in styled components, I'm considering the possibility using CSS modules. So here comes this post.

Since I have met the CORS issues for a while and this time I got stuck with it during the development of the real commercial project.
I got to do some research to make it clear.