
Overview
It's not easy to create a proper multiple series boxplot chart with decent tooltips in Echarts, and it will be much more complex when combining boxplot chart with outliers. I'm going to tell you how to make that happen and what's the pros and cons of each approach in this article.
Different approaches to create a proper multiple series boxplot chart
There are normally two different approaches to create a proper multiple series boxplot chart, one is to use the old school series.data method, the other way is to use the dataset property, and I'm going to dive into the way using dataset property.
The common way to create a multiple datasets with multiple series boxplot chart
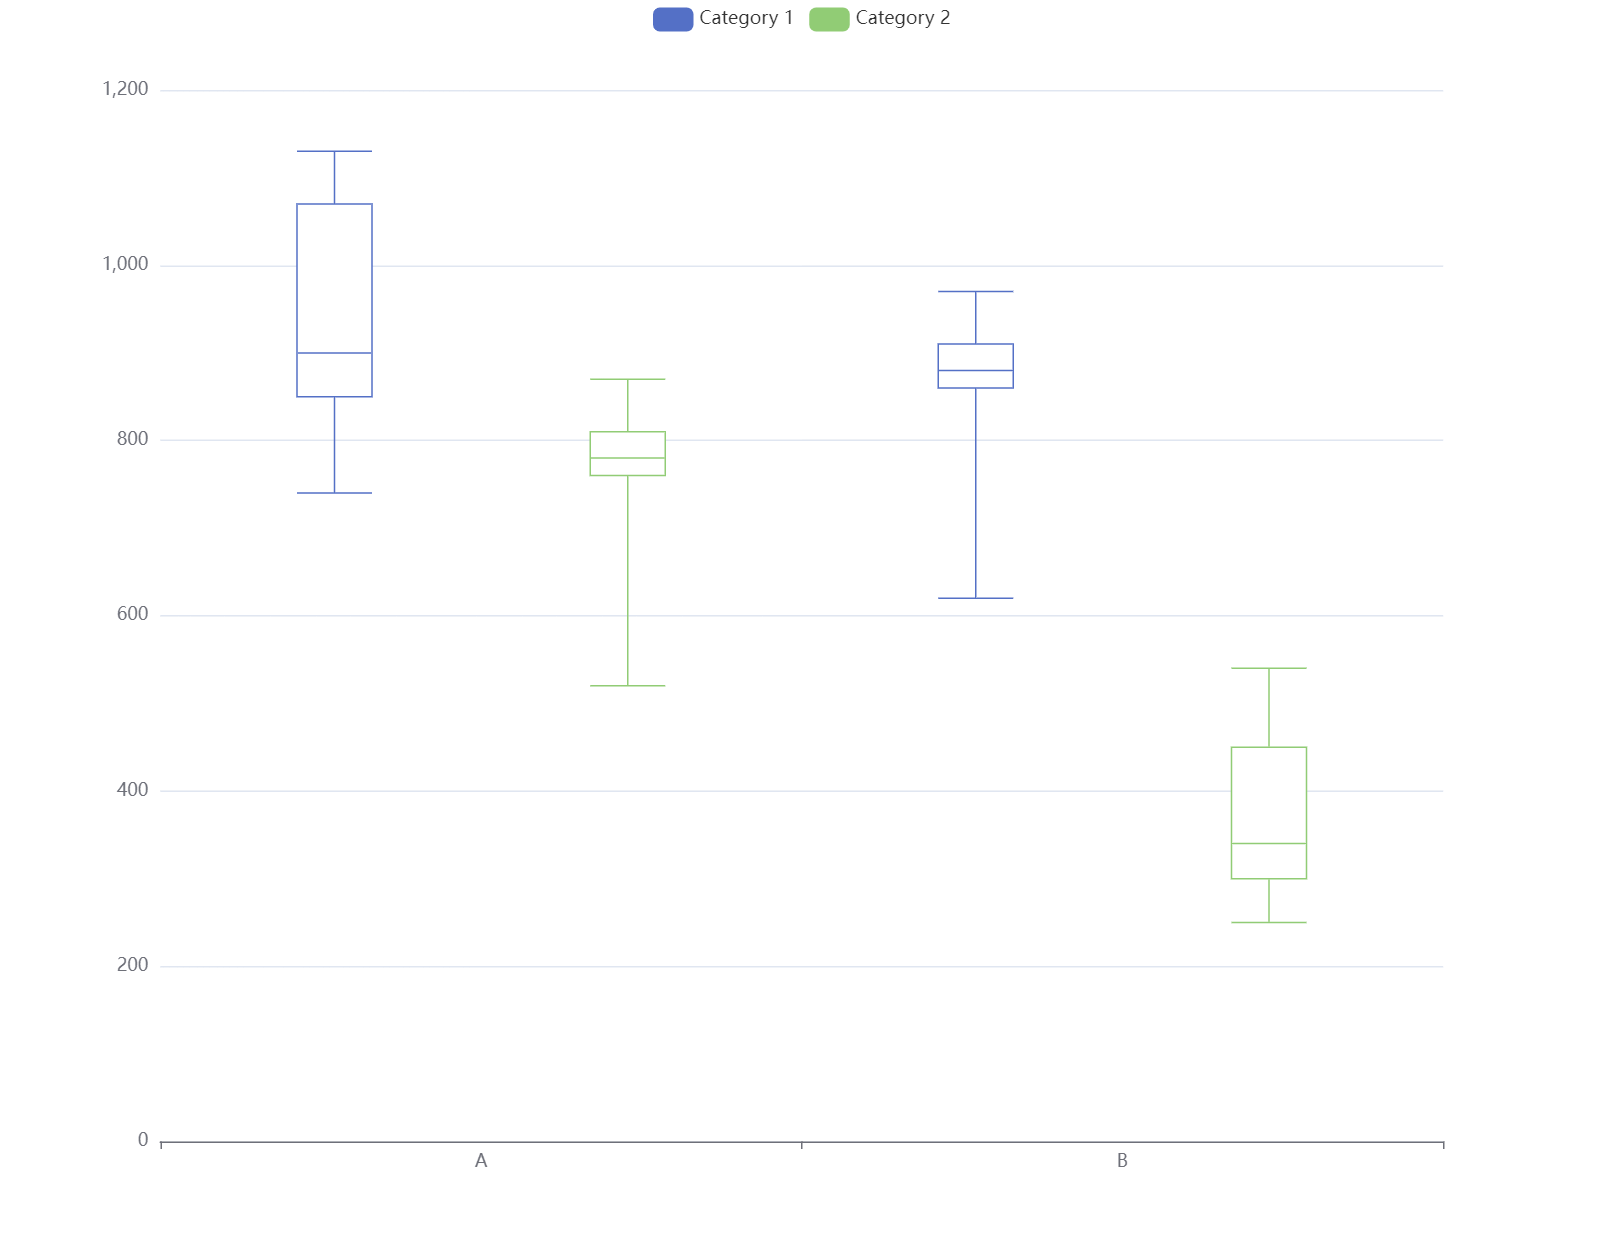
Code
option = {
  legend:{},
  dataset: [
    {
      dimensions:["name", "min", "Q1", "median", "Q3", "max"],
      source: [
          ["A", 740, 850, 900, 1070, 1130 ],
          ["B", 620, 860,  880, 910, 970, ],
      ]
    },
     {
      dimensions:["name", "min", "Q1", "median", "Q3", "max"],
      source: [
        ["A", 520, 760,  780, 810, 870],
        ["B", 250, 300, 340, 450, 540 ],
      ]
    },
  ],
  tooltip: {
    trigger: 'item',
  },
  xAxis: {
    type: 'category',
  },
  yAxis: {
    type: 'value',
  },
  series: [
    {
      name: 'Category 1',
      type: 'boxplot',
      datasetIndex: 0,
      encode:{
        x: "name",
        y:["min", "Q1", "median", "Q3", "max"],
        tooltip:["min", "Q1", "median", "Q3", "max"],
      }
    },
    {
      name: 'Category 2',
      type: 'boxplot',
      datasetIndex: 1,
      encode:{
        x: "name",
        y:["min", "Q1", "median", "Q3", "max"],
        tooltip:["min", "Q1", "median", "Q3", "max"],
      }
    },
  ]
};
How to integrate boxplot chart with scatter (outliers) chart
It's common to show outliers in boxplot chart, and it can be done with combining boxplot chart with scatter chart.I'm going to show how to achieve it.
There are multiple ways to combine boxplot chart with scatter chart, each has it's own pros and cons, let's take a look at them one by one.
1. Using different dataset and series for each category and each related outlier, category axis is the chart title
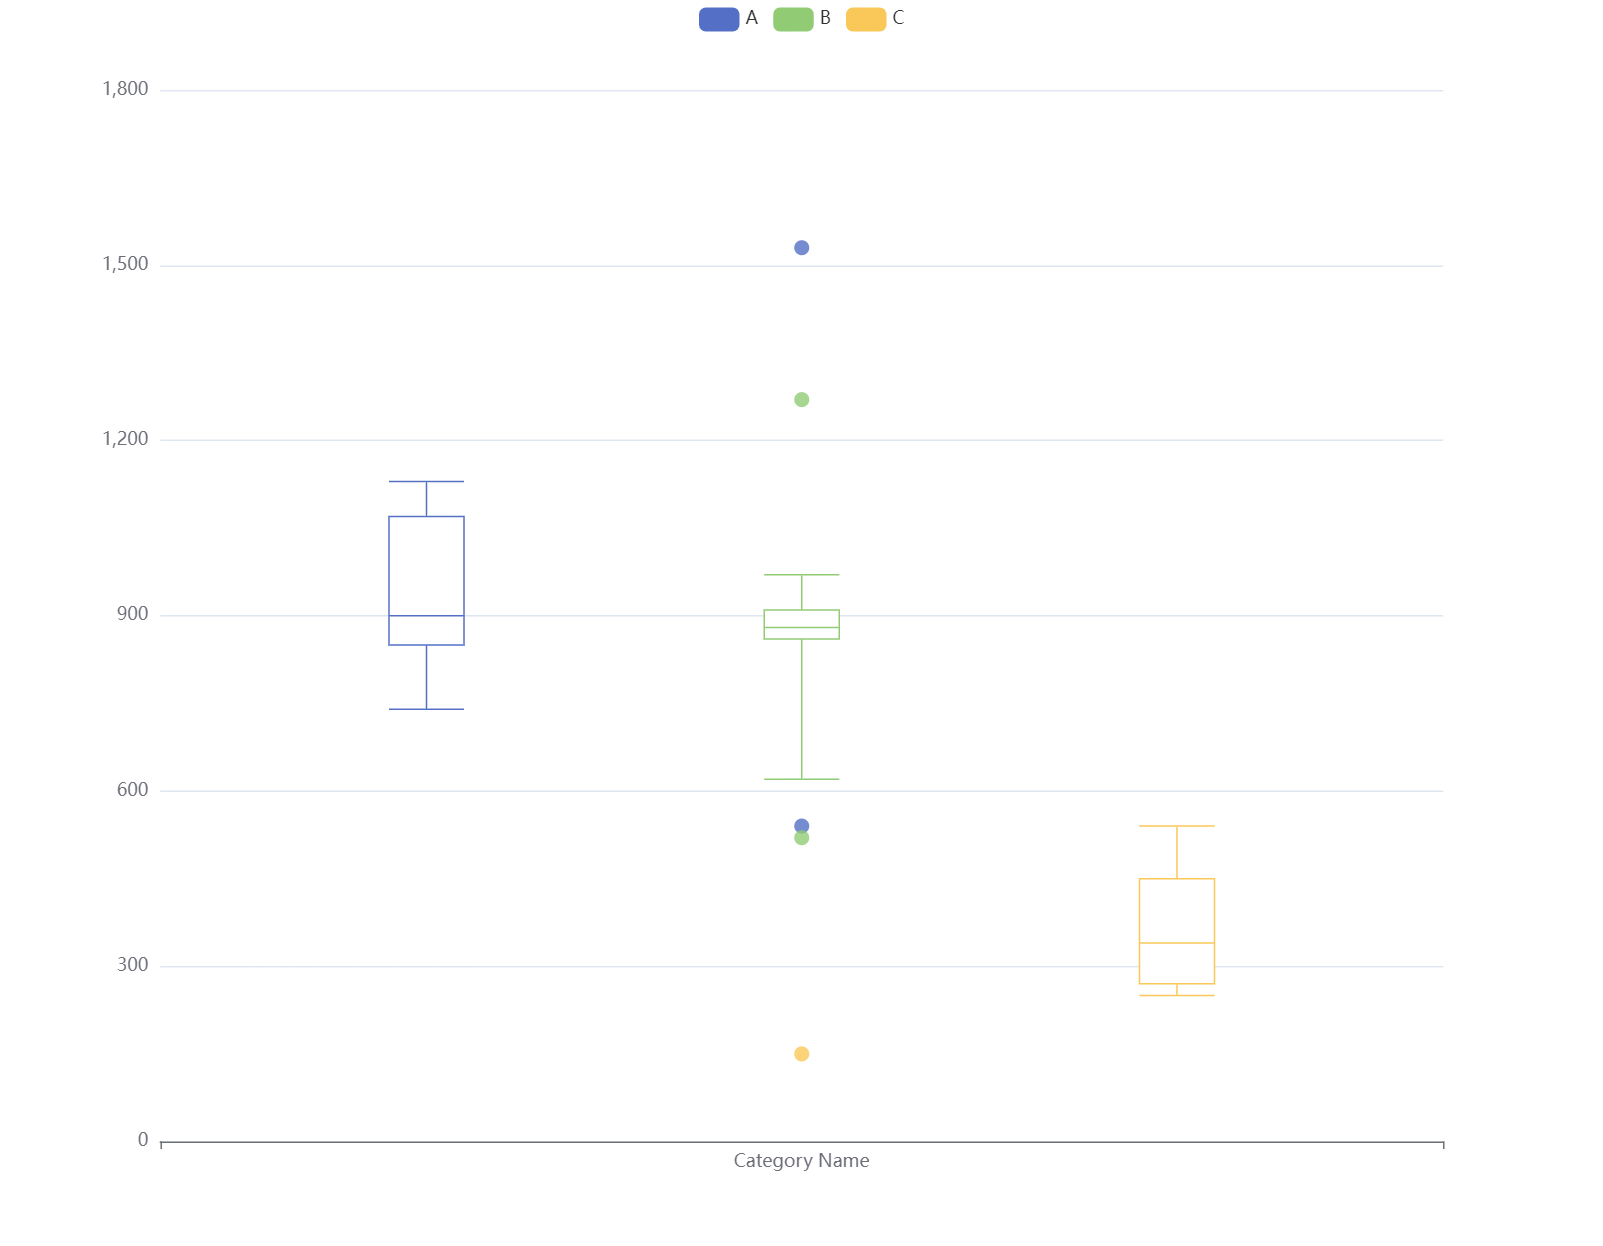
Code
option = {
  legend:{},
  dataset: [
    {
      dimensions:["name", "min", "Q1", "median", "Q3", "max"],
      source: [
        ["Category Name", 740, 850, 900, 1070, 1130 ],
      ]
    },
     {
      dimensions:["name", "min", "Q1", "median", "Q3", "max"],
      source: [
        ["Category Name", 620, 860,  880, 910, 970, ],
      ]
    },
     {
      dimensions:["name", "min", "Q1", "median", "Q3", "max"],
      source: [
        ["Category Name", 250, 270, 340, 450, 540],
      ]
    },
    {
      source: [
        ["Category Name", 540],
        ["Category Name", 1530 ]
      ]
    },
     {
      source: [
        ["Category Name", 520],
        ["Category Name",1270 ],
      ]
    },
     {
      source: [
        ["Category Name", 150],
      ]
    }
  ],
  tooltip: {
    trigger: 'item',
  },
  xAxis: {
    type: 'category',
  },
  yAxis: {
    type: 'value',
  },
  series: [
    {
      name: 'A',
      type: 'boxplot',
      datasetIndex: 0,
      encode:{
        x: "name",
        y:["min", "Q1", "median", "Q3", "max"],
        tooltip:["min", "Q1", "median", "Q3", "max"],
      }
    },
     {
      name: 'B',
      type: 'boxplot',
      datasetIndex: 1,
      encode:{
        x: "name",
        y:["min", "Q1", "median", "Q3", "max"],
        tooltip:["min", "Q1", "median", "Q3", "max"],
      }
    },
     {
      name: 'C',
      type: 'boxplot',
      datasetIndex: 2,
      encode:{
        x: "name",
        y:["min", "Q1", "median", "Q3", "max"],
        tooltip:["min", "Q1", "median", "Q3", "max"],
      }
    },
     {
      name: 'A',
      type: 'scatter',
      datasetIndex: 3
    },
    {
      name: 'B',
      type: 'scatter',
      datasetIndex: 4
    },
    {
      name: 'C',
      type: 'scatter',
      datasetIndex: 5
    }
  ]
};
Pros:
- Clear and straightforward
Cons:
- All the outliers only show at the middle of the chart, and it's not possible to distinguish them from each other
2. Using different dataset and series for each category and each related outlier
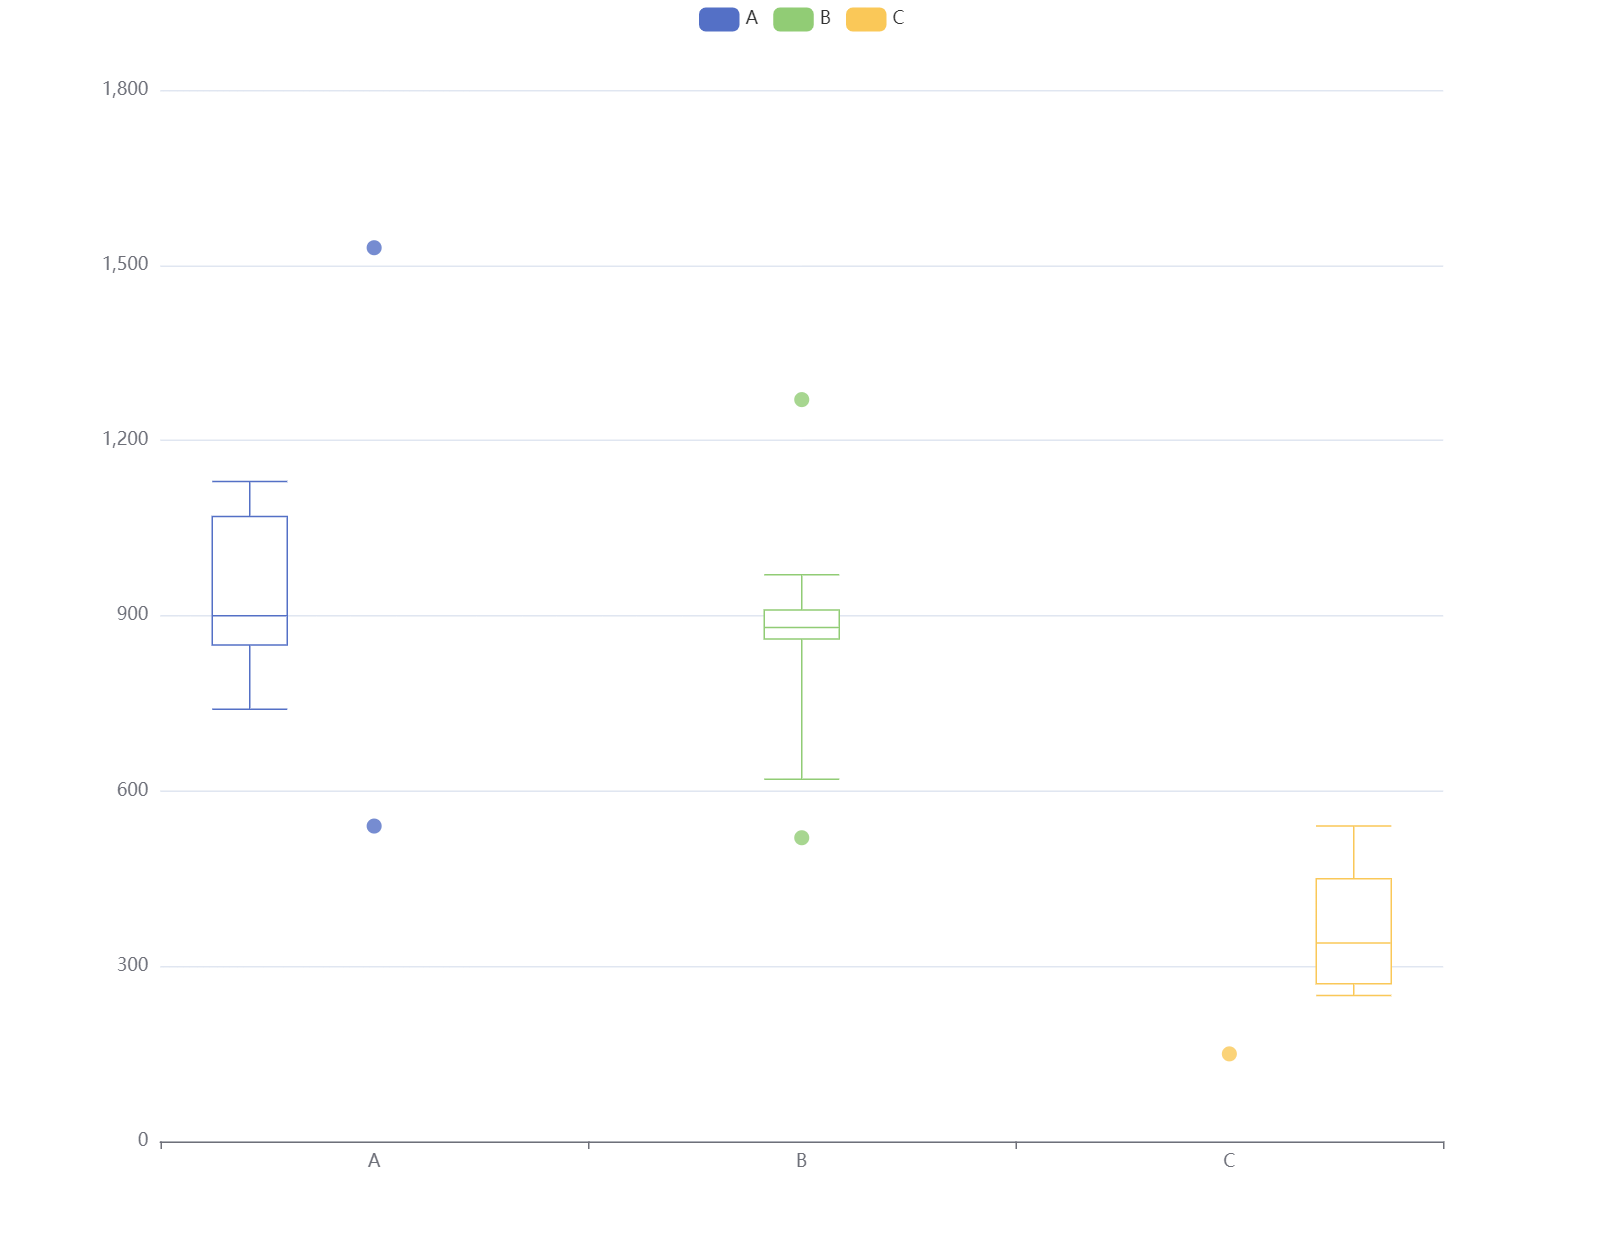
Code
option = {
  legend:{},
  dataset: [
    {
      dimensions:["name", "min", "Q1", "median", "Q3", "max"],
      source: [
        ["A", 740, 850, 900, 1070, 1130 ],
      ]
    },
     {
      dimensions:["name", "min", "Q1", "median", "Q3", "max"],
      source: [
        ["B", 620, 860,  880, 910, 970, ],
      ]
    },
     {
      dimensions:["name", "min", "Q1", "median", "Q3", "max"],
      source: [
        ["C", 250, 270, 340, 450, 540],
      ]
    },
    {
      source: [
        ["A", 540],
        ["A", 1530 ]
      ]
    },
     {
      source: [
        ["B", 520],
        ["B",1270 ],
      ]
    },
     {
      source: [
        ["C", 150],
      ]
    }
  ],
  tooltip: {
    trigger: 'item',
  },
  xAxis: {
    type: 'category',
  },
  yAxis: {
    type: 'value',
  },
  series: [
    {
      name: 'A',
      type: 'boxplot',
      datasetIndex: 0,
      encode:{
        x: "name",
        y:["min", "Q1", "median", "Q3", "max"],
        tooltip:["min", "Q1", "median", "Q3", "max"],
      }
    },
     {
      name: 'B',
      type: 'boxplot',
      datasetIndex: 1,
      encode:{
        x: "name",
        y:["min", "Q1", "median", "Q3", "max"],
        tooltip:["min", "Q1", "median", "Q3", "max"],
      }
    },
     {
      name: 'C',
      type: 'boxplot',
      datasetIndex: 2,
      encode:{
        x: "name",
        y:["min", "Q1", "median", "Q3", "max"],
        tooltip:["min", "Q1", "median", "Q3", "max"],
      }
    },
     {
      name: 'A',
      type: 'scatter',
      datasetIndex: 3
    },
    {
      name: 'B',
      type: 'scatter',
      datasetIndex: 4
    },
    {
      name: 'C',
      type: 'scatter',
      datasetIndex: 5
    }
  ]
};
Pros:
- Easy to understand
Cons:
- Each outlier for a category shows next to each category boxplot, they are not really together
- There is a workaround mentioned here if there is no dynamic change with the chart. eg. No legend clicking, etc
3. Using one dataset for all categories, one dataset for all outliers, and multiple series(legends)
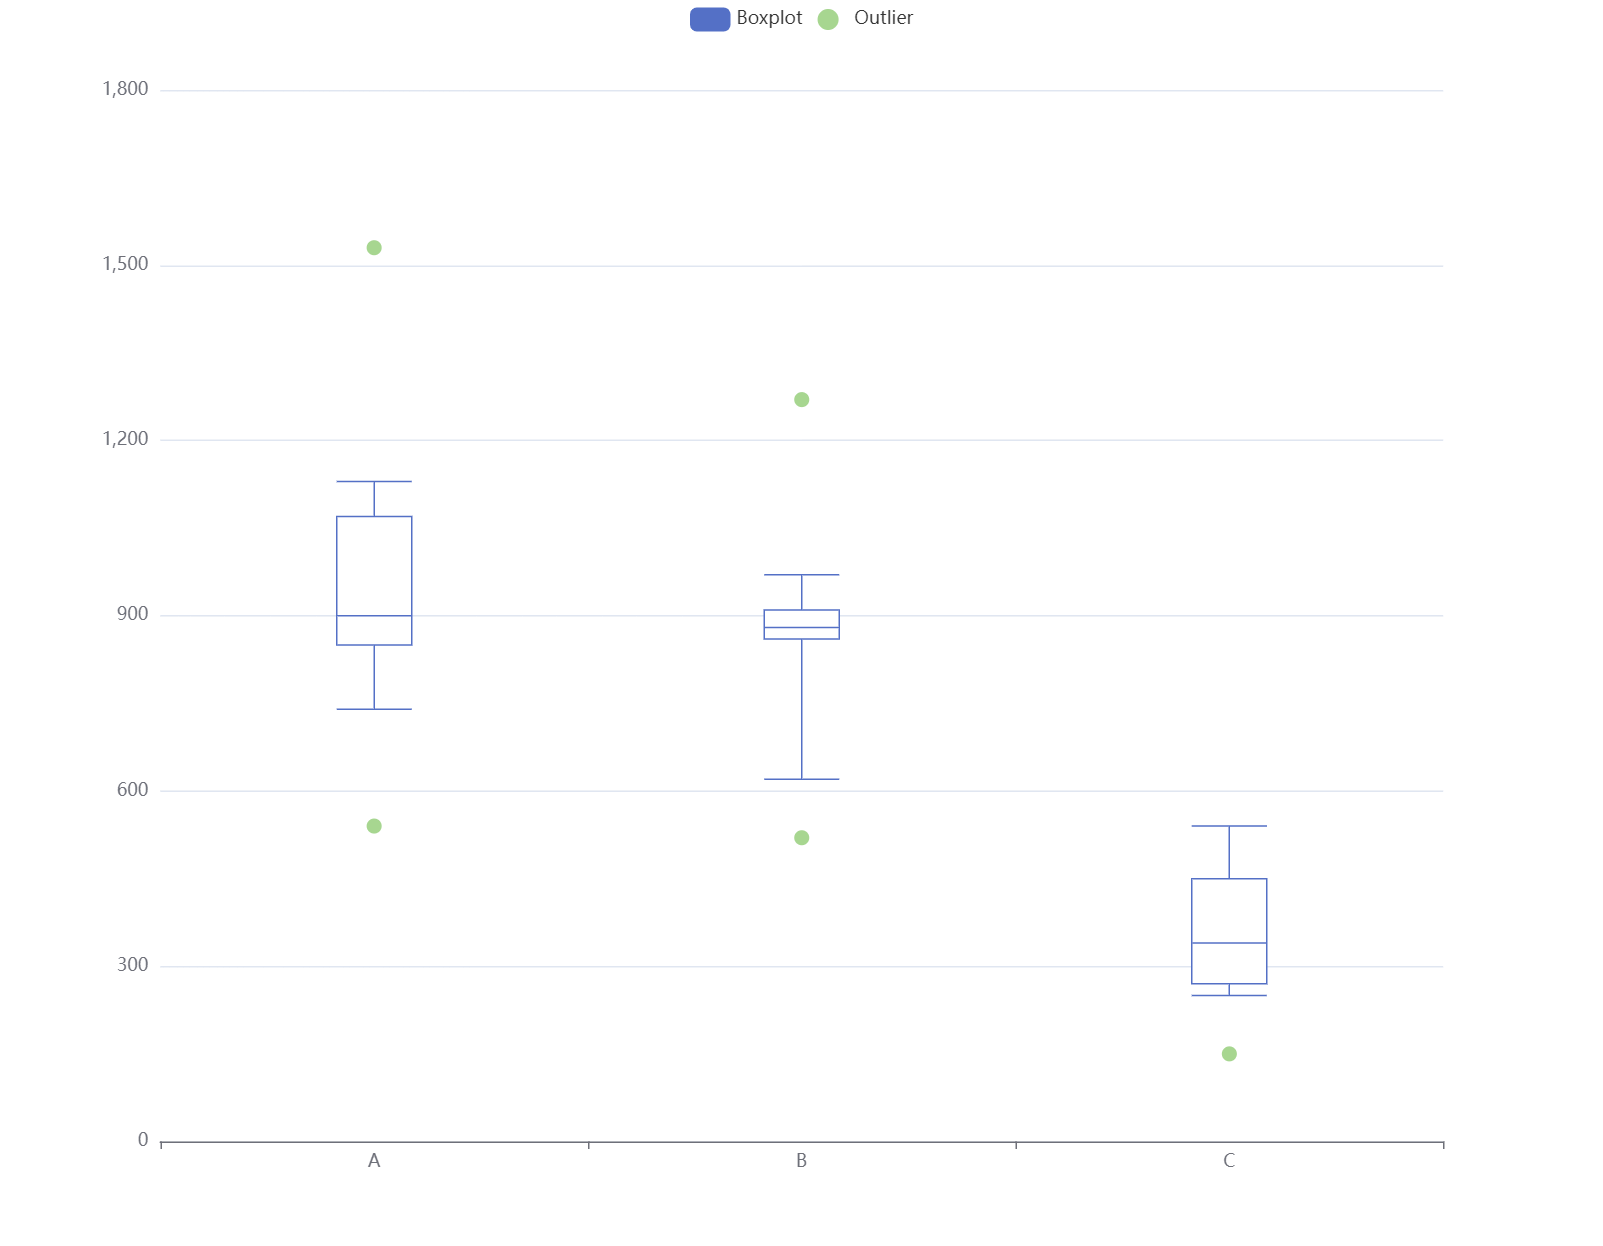
Code
option = {
  legend:{},
  dataset: [
    {
      dimensions:["name", "min", "Q1", "median", "Q3", "max"],
      source: [
        ["A", 740, 850, 900, 1070, 1130 ],
        ["B", 620, 860,  880, 910, 970, ],
        ["C", 250, 270, 340, 450, 540],
      ]
    },
    {
      source: [
        ["A", 540],
        ["A", 1530 ],
        ["B", 520],
        ["B",1270 ],
        ["C", 150],
      ]
    }
  ],
  tooltip: {
    trigger: 'item',
  },
  xAxis: {
    type: 'category',
  },
  yAxis: {
    type: 'value',
  },
  series: [
    {
      name: 'Boxplot',
      type: 'boxplot',
      datasetIndex: 0,
      encode:{
        x: "name",
        y:["min", "Q1", "median", "Q3", "max"],
        tooltip:["min", "Q1", "median", "Q3", "max"],
      },
    },
     {
      name: 'Outlier',
      type: 'scatter',
      datasetIndex: 1,
    }
  ]
};
Pros:
- The outlier can be together with boxplot
Cons:
- It's not possible to show the legend for each category
- There are two legends, one for boxplot and one for outliers
- It could be improved to only has one legend which means the boxplot and outliers are in the same legend
- The boxplot for different categories are with the same color
- It could be improved to have different colors for different categories with the
colorByproperty within each series
- It could be improved to have different colors for different categories with the
3.1 Improved version based on option 3
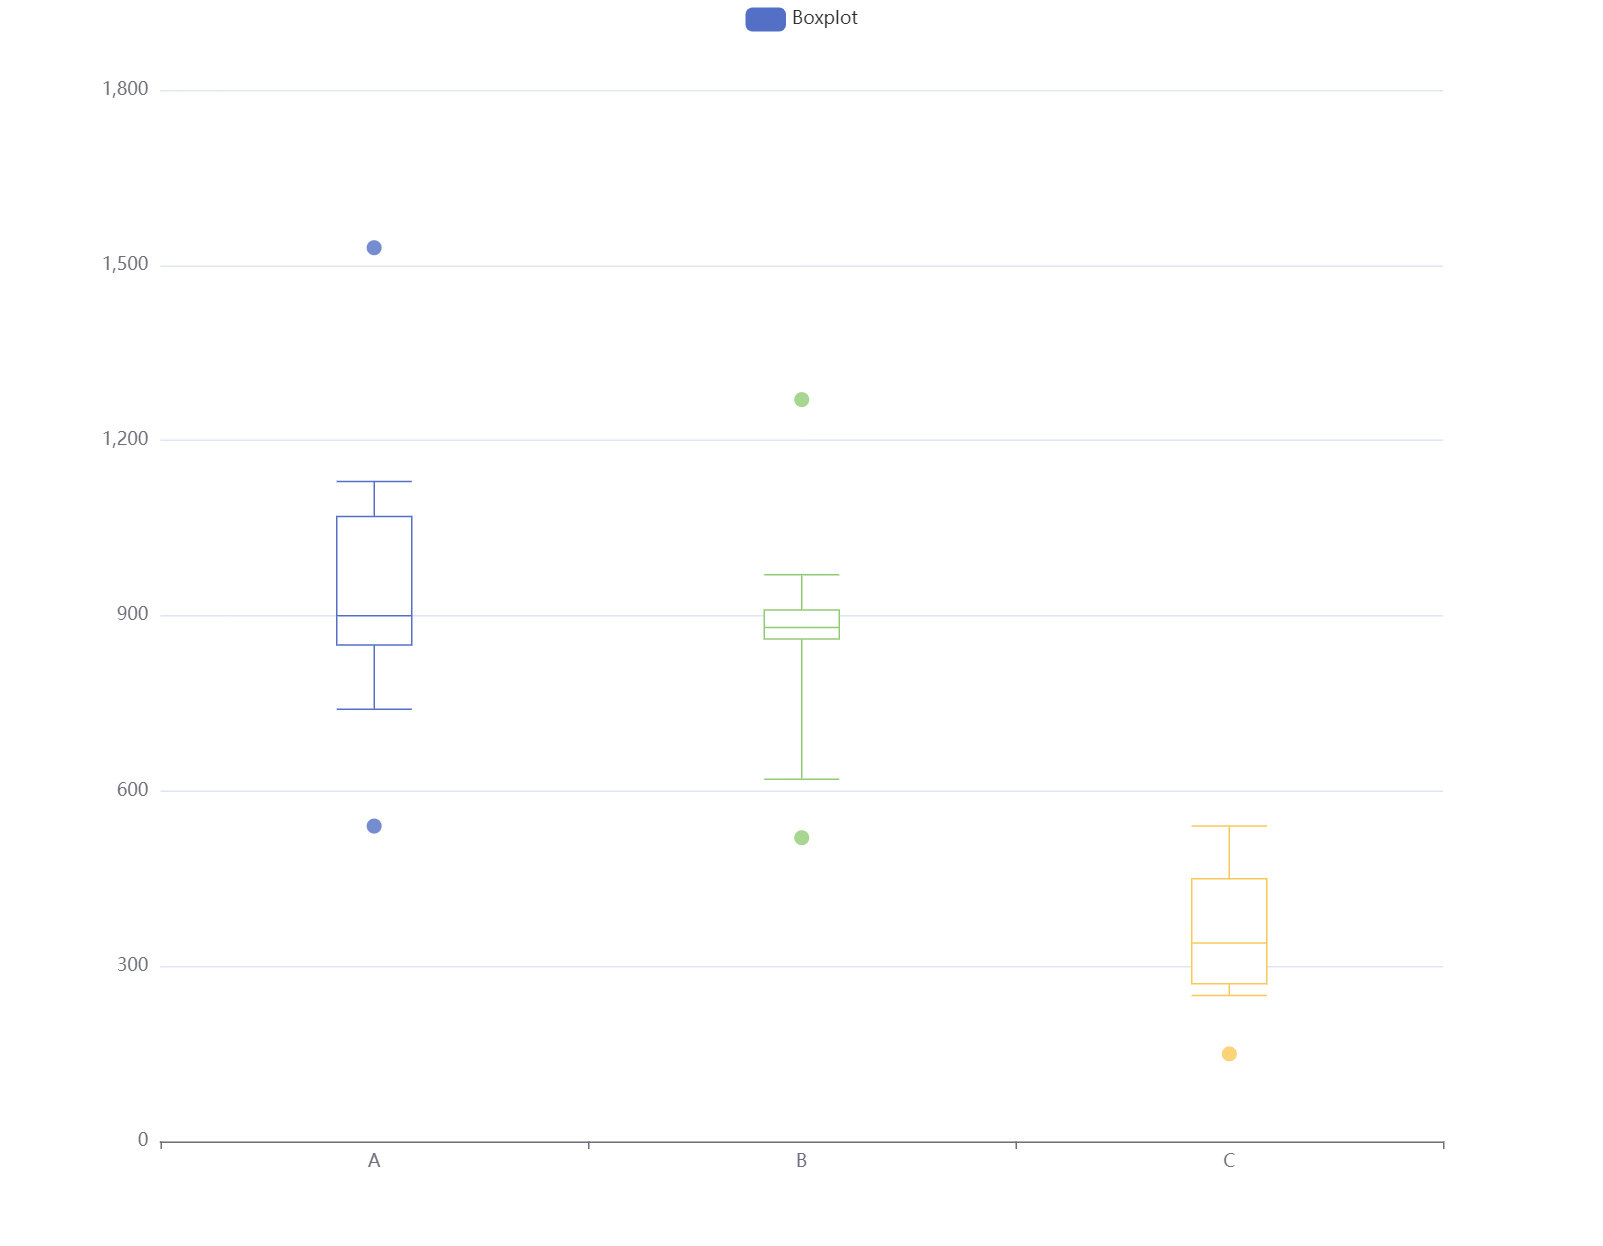
Code
option = {
  legend:{},
  dataset: [
    {
      dimensions:["name", "min", "Q1", "median", "Q3", "max"],
      source: [
        ["A", 740, 850, 900, 1070, 1130 ],
        ["B", 620, 860,  880, 910, 970, ],
        ["C", 250, 270, 340, 450, 540],
      ]
    },
    {
      source: [
        ["A", 540],
        ["A", 1530 ],
        ["B", 520],
        ["B",1270 ],
        ["C", 150],
      ]
    }
  ],
  tooltip: {
    trigger: 'item',
  },
  xAxis: {
    type: 'category',
  },
  yAxis: {
    type: 'value',
  },
  series: [
    {
      name: 'Boxplot',
      type: 'boxplot',
      datasetIndex: 0,
      encode:{
        x: "name",
        y:["min", "Q1", "median", "Q3", "max"],
        tooltip:["min", "Q1", "median", "Q3", "max"],
      },
      colorBy:"data",
    },
     {
      name: 'Boxplot',
      type: 'scatter',
      datasetIndex: 1,
      colorBy:"data",
    }
  ]
};
Final Thoughts
There are to many ways to create the same boxplot chart, but all of them have their own pros and cons. The best way to decide which one to use is to try them and see which one works best for you
Future Improvements
- Using the inbuilt
transformproperty to make the boxplot chart more flexible
